Collisions ICBC: Fancy Running Into You Here!
The latest edition of Quick Statistics has been published by ICBC. The new rounded data it contains is for the year 2016 and that year there were 330,000 collisions reported where 64,000 resulted in either injury or fatality. Over all, collision rates have steadily increased from 2011 to 2016.
After browsing through the document I see that ICBC issued 3,370,000 Autoplan and temporary policies. At first glance, that’s about one collision for every ten vehicles during the year. (If you want to do the research and the math, I’ll let you refine and justify that number.)
288 people died, down 7 from 2015, but still above the five year average of 285. To be included in these numbers, a motor vehicle had to be involved and the incident had to take place on a public road. Collisions involving only cyclists or cyclists and pedestrians are not tracked, possibly because there is no Autoplan claim involved.
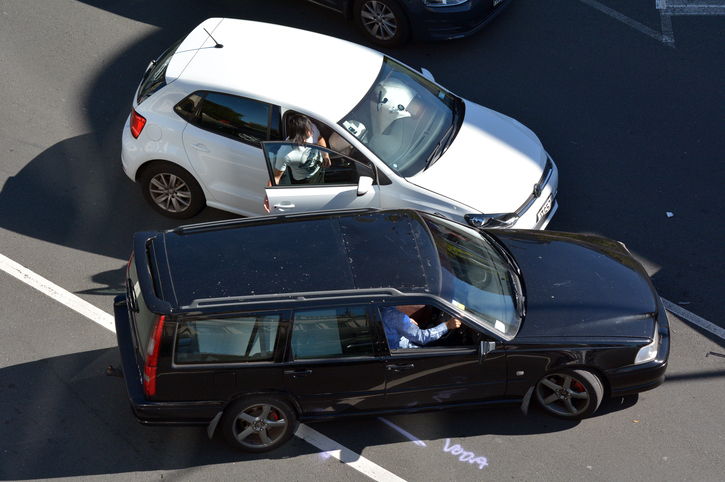
Obviously, we run into each other a lot and many people are hurt, some fatally.
If you’re interested, the crash involvement lists animals (11,000), cyclists (2,100), heavy vehicles(15,000), hit & run (54,000), motorycles (2,600) and pedestrians (3,100).
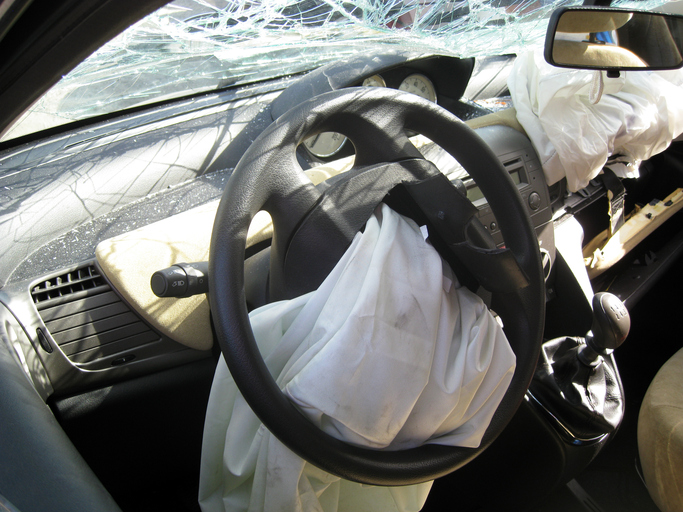
Despite many years of education and enforcement, 58 fatal victims were not wearing their seatbelt. By now, you would think that everyone knew how to wear a seatbelt properly and that it must always be used to prevent being out of place when the airbag deploys.
Intersections are dangerous places as about one third of collisions occur there. Crash maps are available for the Lower Mainland, Vancouver Island, the Southern Interior and the North Central region intersections in B.C.
Why are these crashes happening? ICBC attributes them to five broad reasons: speed, impaired driving, distracted driving, high risk driving and driving too fast for conditions. For fatal crashes speed is the primary contributing factor in 30% of them, followed by distracted driving at 28% and impaired driving at 22%.
High-risk driving behaviour includes failing to yield right of way, following too closely, ignoring a traffic control device, improper passing and speed.
Our government announced the move toward a Vision Zero model for reducing collisions in January 2016. The introduction explains:
British Columbia’s goal is to have the safest roads in North America by 2020. In line with the Vision Zero movement, the ultimate goal is to eliminate motor vehicle crash fatalities and serious injuries. The British Columbia vision will be achieved by: targeting key areas of concern; advancing the Safe System Approach; continuing with the implementation of the BC Road Safety Strategy; and enhancing road safety research capacity in the province. Improved communication and engagement with all British Columbia citizens, particularly local communities, stakeholders, and First Nations, is essential for moving toward Vision Zero .
Better road safety is not achieved by accident; it is created through deliberate, innovative, and evidence – driven practices. Step by step, kilometre by kilometre , British Columbia’s roads can be made safer for everyone.
The responsibility for reducing these significant numbers ultimately lies with you and me. A great place to start would be a return to an attitude of respect for each other when we share the highway. Otherwise, we’ll continue to say “fancy running into you here!”
Excerpt extracted from ILSTV
Are you High Risk driver? Contact High Risk Auto Pros!